ICAD RELATED PUBLICATIONS
In situ measurement studies involving ICAD instruments
In situ measurement studies involving ICAD instruments
Christina Schmidt, C. David Carslaw, J. Naomi Farren, N. René Gijlswijk, Markus Knoll, E. Norbert Ligterink, Jan Pieter Lollinga, Martin Pechout, Stefan Schmitt, Michal Vojtíšek, Quinn Vroom, Denis Pöhler, Optimisation and validation of Plume Chasing for robust and automated NOx and particle vehicle emission measurements, Atmospheric Environment: X, Volume 25, 2025, 100317, ISSN 2590-1621, https://doi.org/10.1016/j.aeaoa.2025.100317. (https://www.sciencedirect.com/science/article/pii/S2590162125000073)
High-emitting vehicles comprise a small proportion (<20%) of the vehicle fleet, yet are responsible for the majority (>50%) of vehicle emissions. Plume Chasing is a reliable, high-precision measurement technique that derives emissions without interfering with the vehicle being tested. Its characteristics make it well suited for high emitter identification. In this study, the influence of several Plume Chasing measurement and data processing methods on the results of derived on-road NOx and particle fuel-specific emission factors are investigated. A range of vehicles, representative of a common vehicle fleet, were tested under different driving conditions on a test track. The derived results were evaluated against on-board SEMS (Smart Emission Measurement System) emission measurements. We found that one of the best performing Plume Chasing data processing methods is based on the use of a rolling minimum for background determination. The average absolute deviation of the determined NOx/CO2 emission ratios from the reference was −0.2(46)ppm/% for the heavy duty vehicle and 0.3(29)ppm/% for the light duty vehicles tested. The methods were easy to automate and suitable for high emitter detection and quantification of emissions from two-wheeled vehicles. Inaccurate emission factors derived from Plume Chasing measurements occurred only in situations when emissions were significantly influenced by a strong plume from vehicles driving directly ahead of the vehicle of interest.

Authors: Christina Schmidt & Dr. Denis Pöhler
This report summarises the results of a project, applying the Airyx plume chasing measurement system to investigate NOx and particle emissions of Heavy Duty Vehicles (HDVs), Light Commercial Vehicles (LCVs) and Passenger Cars (PCs) in Slovakia between 05th September and 5th October 2023. The focus was on HDVs where high emitters were identified. For a few days, identified high emitting HDVs were stopped by the police for further inspection. The inspections were supported by technical experts using OBD inspection tool (W.EASY DETECTIVE). The project was carried out as a collaboration between the International Council on Clean Transportation, TU Graz, Airyx, ISA UK Ltd and TSA spol. s r.o. and Wabcowürth for inspections. The study shows that emission inspection with plume chasing is well suited for efficiently obtaining precise emission values for NOx and particles (Black Carbon (BC) and Particle Number (PN)) from individual vehicles. It allows to reliably identify high emitters due to defective and manipulated emission systems. For HDVs this could be proven with the performed inspections.

Author: Denis Pöhler, on behalf of Flanders Environmental Agency Dr. De Moorstraat 24-26 9300, Aalst, Belgium
This report summarises the results of a project, applying the Airyx plume chasing measurement system, for detection of high emitter, heavy duty vehicles (HDV) in Flanders (Belgium) 23.11. – 08.12.2021 and the following inspection of the selected HDVs. The project was carried out as a collaboration between the Flanders environmental Agency, Vlabel Controle and Airyx. The study demonstrates that the emission inspection with plume chasing is well suited to efficiently identify individual defective and manipulated HDVs for further inspection.
In conclusion, the application of Airyx Plume Chasing measurement systems for NOx can effectively support authorities in identifying high emitters caused by defective and/or manipulated HDVs. A big advantage is that the system is simple to operate and works under rainy and/or cold weather conditions. Even if cold SCR situations are reduced, the high rate of high emitters categorised as cold SCR should further be reduced. The system allows identifying many of these cold SCR from the data collected and thus avoiding unnecessary inspections. More investigations are required as to why such a high rate of cold SCRs are categorised in this study compared to other studies. The upcoming question is, if these are undetected defects / manipulations in the inspection especially as many manipulations pretend the system a cold system. It could also be that the plume chasing measurement can be further improved to avoid a false classification. Currently an improved training of inspectors, in interpreting the plume chasing measurements, could already avoid many of the cases of a cold SCR causing a full unnecessary inspection.
. Two sampling inlets are combined to one sampling hose to the ICAD plume chasing instrument in the trunk.")


Eine Studie in der Steiermark, Österreich 2022 mit der „Plume-Chasing“ Messmethode
Autor: Denis Pöhler, im Auftrag des Amt der Steiermärkischen Landesregierung
Zusammenfassung: Dieser Bericht fasst die Ergebnisse eines Projekts zusammen, bei dem das Airyx-Plume-Chasing-Messsystem zur Erkennung von schweren Nutzfahrzeugen (LKW) mit hohen NOx Emission in der Steiermark (Österreich) vom 10. bis 25. November 2022 eingesetzt wurde. Hohe NOx Emissionen bei warmem Motor / SCR System sind bei EURO V und EURO VI LKWs auf ein defektes oder manipuliertes SCR Abgassystem zurückzuführen. Identifizierte Fahrzeuge mit hohen Emissionen wurden im Anschluss durch die Polizei angehalten und zu einer gründlichen technischen Unterwegskontrolle gem. Anhang II der Richtlinie 2014/47/EU durch die Amtssachverständigen der Landesprüfstelle Steiermark zugeführt.
Die Studie untersucht, ob das Plume-Chasing-Messsystem geeignet ist, defekte und manipulierte schwere Nutzfahrzeuge für die weitere Fahrzeugkontrolle verlässlich und effizient zu identifizieren und somit die Kontrolle von ordnungswidrig betriebenen Fahrzeugen zu vereinfachen. Da die Kontrollen aufwändig, zeitintensiv und der Nachweis vor allem einer Manipulation schwierig ist, kann durch die verlässliche Vorauswahl sich auf die relevanten betroffenen Fahrzeuge konzentriert werden. Dies erhöht die Effizienz der Kontrollbehörden und vermeidet Kontrollen an korrekt funktionierenden LKW.
. Two gas samples are connected to a gas line and led to the ICAD measuring device in the trunk.")

Denis Pöhler, Christina Schmidt, Martin Horbanski, Stefan Schmitt, Johannes Lampel, Identification of Manipulated & Defective Truck NOx Emission Reduction Systems with Plume Chasing for Authority Inspections, Transportation Research Procedia, Volume 72, 2023, Pages 1661-1668, ISSN 2352-1465, https://doi.org/10.1016/j.trpro.2023.11.638. (https://www.sciencedirect.com/science/article/pii/S2352146523009365)
Abstract: The PC method allows reliable RDE investigations of individual vehicles whilst measuring in the diluted emission plume behind a vehicle. Recent technical developments, now allow compact PC measurement setups for NOx emissions with low maintenance and simple operation making the technique attractive for authorities to use, in order to optimize inspections. The current focus is the identification of high HDV emitters due to illegal manipulations and/or defects of the SCR emission reduction system. A relative high rate of 10% to 20% of HDVs show suspicious or high emission values. In a study in Denmark with local authorities and the police, over 478 HDVs were investigated. The inspection of the suspicious and high emitters proved, that most of these vehicles were defective (67%) or actively manipulated (24%).
Keywords: Plume chasing; emulator; SCR manipulation; NOx emissions; high emitter detection, inspection
, EURO V (center) and EURO VI (right).")
Christina Schmidt, Denis Pöhler, Stefan Schmitt, Ulrich Platt, Quinn Vroom, Norbert E. Ligterink, Naomi J. Farren, David C. Carslaw, Åke Sjödin, Towards better air quality using the plume chasing method: validation studies of real driving NOx emission measurements of vehicles, Transportation Research Procedia, Volume 72, 2023, Pages 1848-1854, ISSN 2352-1465, https://doi.org/10.1016/j.trpro.2023.11.662. (https://www.sciencedirect.com/science/article/pii/S2352146523009602)
Abstract: The reliability of Plume Chasing as a Remote Emission Measurement Technique in detecting NOx emissions is investigated. It allows, for example, to identify high-NOx-emitting vehicles with high precision. During a 5-day study of the CARES project, controlled Plume Chasing measurements of different types of vehicles were performed on a test track. The test track experiments included 21 different sessions with different driving properties and different test vehicles representative for a common vehicle fleet. During the experiments, the emission control systems were activated and deactivated in a blind comparison experiment. The Plume Chasing method showed excellent correlation with the averaged reference SEMS NOx data. The main cause for deviations was found to be situations when emissions are significantly influenced by plumes from high emitting vehicles driving ahead.
Keywords: Plume Chasing; SCR Manipulation; CARES; EU research; NOx Emissions; High emitter

Michael Hedges, Max Priestman, M. Chadeau-Hyam, R. Sinharay, Frank J. Kelly, David C. Green, Characterising a mobile reference station (MoRS) to quantify personal exposure to air quality, Atmospheric Environment, Volume 315, 2023, 120160, ISSN 1352-2310, https://doi.org/10.1016/j.atmosenv.2023.120160.
There is increasing clinical, epidemiological, and toxicological evidence linking exposure to air pollution with multiple health outcomes that lead to increased mortality and morbidity. Traditionally, fixed air quality monitors have been used to provide ambient air pollution measurements, but they have spatial and temporal limitations. Rapid advances in instrument miniaturisation have made novel sensing technologies more accessible but these are prone to high sensitivity and inaccuracies. To bridge the gap between fixed monitors and small sensors we have developed a Mobile Reference Station (MoRS) – a portable platform delivering high quality measurements of air pollutants using smaller, low power reference grade instruments at high time resolutions. MoRS enables the simultaneous measurement of a broad aerosol size distribution (10 nm–35 μm), gaseous pollutant concentrations (nitrogen dioxide (NO2) and ozone (O3)), environmental parameters (noise, relatively humidity (RH) and temperature) as well as collecting filter samples for laboratory analysis. The MoRS instrumentation is described and the major challenges in ensuring that high data quality standards are maintained are discussed. Laboratory and field tests were used to derive scaling factors for all the MoRSinstrumentation. Field testing of MoRS showed excellent intercomparability against reference instrumentation (R2 > 0.98) and good agreement with reference instruments in the ultrafine aerosol range, although there was an overestimation of fine particle aerosols. Measurements taken during example mainline train and London Underground (LU) journeys are displayed showing the value of the high-quality data derived from MoRS and how this can help to disentangle multiple confounding environmental pollutants and enrich epidemiological studies.

Naomi J. Farren, Christina Schmidt, Hannes Juchem, Denis Pöhler, Shona E. Wilde, Rebecca L. Wagner, Samuel Wilson, Marvin D. Shaw, David C. Carslaw, Emission ratio determination from road vehicles using a range of remote emission sensing techniques, Science of The Total Environment, 2023, 162621, ISSN 0048-9697, https://doi.org/10.1016/j.scitotenv.2023.162621.
The development of remote emission sensing techniques such as plume chasing and point sampling has progressed significantly and is providing new insight into vehicle emissions behaviour. However, the analysis of remote emission sensing data can be highly challenging and there is currently no standardised method available. In this study we present a single data processing approach to quantify vehicle exhaust emissions measured using a range of remote emission sensing techniques. The method uses rolling regression calculated over short time intervals to derive the characteristics of diluting plumes. We apply the method to high time-resolution plume chasing and point sampling data to quantify gaseous exhaust emissions from individual vehicles. Data from a series of vehicle emission characterisation experiments conducted under controlled conditions is used to demonstrate the potential of this approach. First, the method is validated through comparison with on-board emission measurements. Second, the ability of this approach to detect changes in NOx / CO2 ratios associated with aftertreatment system tampering and different engine operating conditions is shown. Third, the flexibility of the approach is demonstrated by varying the pollutants used as regression variables and quantifying the NO2 / NOx ratios for different vehicle types. A higher proportion of total NOx is emitted as NO2 when the selective catalytic reduction system of the measured heavy duty truck is tampered. In addition, the applicability of this approach to urban environments is illustrated using mobile measurements conducted in Milan, Italy in 2021. Emissions from local combustion sources are distinguished from a complex urban background and the spatiotemporal variability in emissions is shown. The mean NOx / CO2 ratio of 1.61 ppb/ppm is considered representative of the local vehicle fleet. It is envisaged that this approach can be used to quantify emissions from a range of mobile and stationary fuel combustion sources, including non-road vehicles, ships, trains, boilers and incinerators.

Finkenzeller, H., Pöhler, D., Horbanski, M., Lampel, J., and Platt, U.: New methods for the calibration of optical resonators: integrated calibration by means of optical modulation (ICOM) and narrow-band cavity ring-down (NB-CRD), Atmos. Meas. Tech., 16, 1343–1356, https://doi.org/10.5194/amt-16-1343-2023, 2023.
Optical resonators are used in spectroscopic measurements of atmospheric trace gases to establish long optical path lengths L with enhanced absorption in compact instruments. In cavity-enhanced broad-band methods, the exact knowledge of both the magnitude of L and its spectral dependency on the wavelength λ is fundamental for the correct retrieval of trace gas concentrations. L(λ) is connected to the spectral mirror reflectivity R(λ), which is often referred to instead. L(λ) is also influenced by other quantities like broad-band absorbers or alignment of the optical resonator. The established calibration techniques to determine L(λ), e.g. introducing gases with known optical properties or measuring the ring-down time, all have limitations: limited spectral resolution, insufficient absolute accuracy and precision, inconvenience for field deployment, or high cost of implementation. Here, we present two new methods that aim to overcome these limitations: (1) the narrow-band cavity ring-down (NB-CRD) method uses cavity ring-down spectroscopy and a tunable filter to retrieve spectrally resolved path lengths L(λ); (2) integrated calibration by means of optical modulation (ICOM) allows the determination of the optical path length at the spectrometer resolution with high accuracy in a relatively simple setup. In a prototype setup we demonstrate the high accuracy and precision of the new approaches. The methods facilitate and improve the determination of L(λ), thereby simplifying the use of cavity-enhanced absorption spectroscopy.
 is measured at a quasi continuous set of phases. The acquired η Meas(ϕ) curve is then fitted into the modelled η Mod(ϕ, τ ) landscape to retrieve the path length. Single shot mode: The apparent transmission η is sampled at a fixed phase ϕ0. The acquired η(ϕ0) is then fitted to a modelled η(ϕ0, τ ) curve to retrieve the path length.")
The spatial recording of the pollutant distribution of nitrogen dioxide (NO2) in an urban area can be realized by the new mobile ICAD measurement technology with limited costs and effort. Repeated measurements at different times are carried out on a fixed route, e.g. with a bicycle, in order to calculate a reliable mean distribution and an extrapolated annual mean value. The possibility of these measurements is illustrated using the example of a study in the city of Walldorf.
(Article in german.)
DOI: https://doi.org/10.37307/j.1868-7776.2021.03.03
Lizenz: ESV-Lizenz
ISSN: 1868-7776
Ausgabe / Jahr: 3 / 2021
Veröffentlicht: 2021-08-26

This report summarises the result of a project for high emitter heavy duty vehicle (HDV) detection in Denmark (17.9. – 01.10.2020) and followed police inspection of the HDV with high and suspicious emissions. The project is carried out as a collaboration between the Danish Road Traffic Authority, the Danish National Police and Airyx.

Proof of concept investigations for MANN+HUMMEL Filter Cube Installation at Stuttgart, Neckartor (German version). Experiments were conducted in 2019 with three hardware configurations, showing the effectiveness of fine dust filter setups as well as activated carbon filter elements on the respective immission levels.

What new applications are offered by a measuring device for nitrogen oxides developed at the Institute of Environmental Physics and now commercially available in the field of mobile immission and emission measurements under real conditions? The following article exemplifies some approaches to provide citizens and decision-makers with reliable and realistic measurement data in the short term, so that necessary and targeted measures for the reduction of air pollutants in cities can be taken.
This includes the mobile determination of the distribution of the legally regulated nitrogen dioxide (NO2), area-wide or in specific problem areas. Furthermore, real emission measurements by means of plume chasing enable the rapid and simple determination of the pollutant emissions of individual vehicles, e.g. buses and trucks. In Europe-wide studies, high nitrogen oxide (NOx) emissions have been identified on various vehicles, indicating to authorities systematically increased emissions, defective or potentially manipulated emission control systems.
(Article in german.)
DOI: https://doi.org/10.37307/j.1868-7776.2019.03.06
Lizenz: ESV-Lizenz
ISSN: 1868-7776
Ausgabe / Jahr: 3 / 2019
Veröffentlicht: 2019-08-27
 und CO2 Konzentrationen in der Abgasfahne gemessen. Das gemessene Verhältnis von Schadstoff zu CO2 ist unabhängig von der Verdünnung der Abgasfahne (nach Korrektur der Hintergrundkonzentration) und ermöglicht ein Berechnen der NOx-Emission des Fahrzeuges.")
 zu neueren Fahrzeugen (rechts).")
Horbanski, M., Pöhler, D., Lampel, J., and Platt, U.: The ICAD (iterative cavity-enhanced DOAS) method, Atmos. Meas. Tech., 12, 3365–3381, https://doi.org/10.5194/amt-12-3365-2019, 2019.
Cavity-enhanced differential optical absorption spectroscopy (CE-DOAS or BB-CEAS DOAS) allows us to make in situ measurements while maintaining the kilometre-long light paths required by DOAS. This technique has been successfully used for several years to measure in situ atmospheric trace gases. A property of optical cavities is that in the presence of strong absorbers or scatterers the light path is reduced, in contrast to classical long-path DOAS measurements where the light path is fixed. Typical CE-DOAS or BB-CEAS evaluation schemes correct this effect using the measured total light intensity attenuation. This makes them sensitive to any variations in the light intensity not arising from the trace gas absorption. That means an important DOAS advantage, to be independent of total light intensity, is actually lost. In order to cope with this problem, the instrument setup would require a thorough stabilisation of the light source and a very rigid mechanical setup, which would make instrumentation more complex and error prone.
We present a new approach to cavity-enhanced (CE) DOAS based on an iterative algorithm (ICAD) which actually models the light path reduction from the derived absorbers in the optical resonator. It allows a sensitive and robust data analysis that does not depend on the total light intensity, allowing a simpler and more compact instrument setup. The algorithm is discussed and simulated measurements demonstrate its sensitivity and robustness. Furthermore, a new ICAD NO2 instrument is presented. It takes advantage of the advanced data evaluation to build a compact (50 cm cavity) and lightweight instrument (<10 kg) with low power consumption (25 W) for sensitive measurements of NO2 with a detection limit of 0.02 ppbv at an averaging time of 7 min. The instrument is characterised with a NO2 calibration source and good long-term stability is demonstrated in a comparison with a commercial chemiluminescence detector. As a new application of ICAD we show measurements on an automobile platform to investigate the two-dimensional NO2 distribution in an urban area. The instrument is so robust that even strong vibrations do not lead to any measurement problems.


Passive remote sensing measurement studies involving SKYSPEC instruments or data analysis methods
Osorio, M., Agesta, A., Bösch, T., Casaballe, N., Richter, A., Alvarado, L. M. A., and Frins, E.: Measurement report: Combined use of MAX-DOAS and AERONET ground-based measurements in Montevideo, Uruguay, for the detection of distant biomass burning, Atmos. Chem. Phys., 24, 7447–7465, https://doi.org/10.5194/acp-24-7447-2024, 2024.
Biomass burning releases large amounts of aerosols and chemical species into the atmosphere, which represents a major source of air pollutants. Emissions and by-products can be transported over long distances, presenting challenges in quantification. This is mainly done using satellites, which offer global coverage and data acquisition for places that are difficult to access. In this study, ground-based observations play an important role in assessing the abundance of trace gases and aerosols. On November 24, 2020, a significant increase in formaldehyde was observed, with a MAX-DOAS instrument located in Montevideo (Uruguay). Vertical column densities reached values of 2.4×10¹⁶ molec. cm-2, more than twice the values observed during the previous days. This was accompanied by an increase in the aerosol levels measured by an AERONET photometer located at the same site. For example, the AOD at 440 nm reached values close to 1, one order of magnitude larger than typical values in Montevideo.
Our findings indicate that the cause of the increase was associated with the passage of a plume originating from distant biomass burning. This conclusion is supported using TROPOMI satellite observations as well as HYSPLIT trajectory simulations. The profiles of the gases and aerosols retrieved from the MAX-DOAS observations are consistent with the HYSPLIT analysis, showing the passage of a plume over Montevideo on November 24 located at a height of ∼1.5 km. This corroborates that biomass burning events that occur about 800 km north of Montevideo can affect the local atmosphere due to long-distance transport of emissions. This study underscores the potential of ground-based atmospheric monitoring as a tool for detection of such events. Furthermore, it demonstrates the greater sensitivity compared to satellite when it comes to detection of relatively small amounts of carbonyls like glyoxal and formaldehyde.
 Map of Montevideo and the geometry used for MAX-DOAS measurements. The observation site is located at the Faculty of Engineering. The spectrometer scans a vertical plane from east to west at several elevations. (right) Picture of the MAX-DOAS instrument (left) and CIMEL sun photometer (right) on the roof of the building. Bottom: RGB satellite images from the VIIRS instrument (NOAA-20) for days (left) November 22, (middle) November 23, and (right) November 24, 2020. The corresponding fire radiative power (FRP) data product was overlaid to visualize the location of the principal burning sources.")
Ryan, R. G., Marais, E. A., Gershenson-Smith, E., Ramsay, R., Muller, J.-P., Tirpitz, J.-L., and Frieß, U.: Measurement report: MAX-DOAS measurements characterise Central London ozone pollution episodes during 2022 heatwaves, Atmos. Chem. Phys., 23, 7121–7139, https://doi.org/10.5194/acp-23-7121-2023, 2023.
Heatwaves are a substantial health threat in the UK, exacerbated by co-occurrence of ozone pollution episodes. Here we report on first use of retrieved vertical profiles of nitrogen dioxide (NO2) and formaldehyde (HCHO) over Central London from a newly installed Multi-Axis Differential Optical Absorption Spectroscopy (MAX-DOAS) instrument coincident with two of three heatwaves for the hottest summer on record. We evaluate space-based sensor observations routinely used to quantify temporal changes in air pollution and precursor emissions over London. Collocated daily mean tropospheric column densities from the high spatial resolution space-based TROPOspheric Monitoring Instrument (TROPOMI) and MAX-DOAS, after accounting for differences in vertical sensitivities, are temporally consistent for NO2 and HCHO (both R = 0.71). TROPOMI NO2 is 27–31 % less than MAX-DOAS NO2, as expected from horizontal dilution of NO2 by TROPOMI pixels in polluted cities. TROPOMI HCHO is 20 % more than MAX-DOAS HCHO; greater than differences in past validation studies, but within the range of systematic errors in the MAX-DOAS retrieval. The MAX-DOAS lowest layer (~55 m altitude) retrievals have similar day-to-day and hourly variability to the surface sites for comparison of NO2 (R ≥ 0.7) and for MAX-DOAS HCHO versus surface site isoprene (R > 0.6) that oxidizes to HCHO in prompt and high yields. Daytime ozone production, diagnosed with MAX-DOAS HCHO-to-NO2 tropospheric vertical column ratios, is mostly limited by availability of volatile organic compounds (VOCs), except on heatwave days. Temperature dependent biogenic VOC emissions of isoprene increase exponentially, resulting in ozone concentrations that exceed the regulatory standard for ozone and cause non-compliance at urban background sites in Central London. Locations in Central London heavily influenced by traffic remain in compliance, but this is likely to change with stricter controls on vehicle emissions of NOx and higher likelihood of heatwave frequency, severity and persistence due to anthropogenic climate change.
, MAX-DOAS HCHO and surface site isoprene (b), MAX-DOAS HCHO:NO2 (c), surface site ozone (d), and maximum air temperature at 60 m (e). MAX-DOAS values are the lowest retrieved layer in (a) and (b) and the vertical 0-8 km column in (c). MAX-DOAS results are the mean of all azimuth angles and surface sites are the mean of multiple sites for NO2 and ozone, and of Marylebone Road 760 only for isoprene (Section 2.4). Error bars are standard deviations of the multi-azimuth daytime means for MAX-DOAS, the site and daytime variability for in situ NO2 and ozone, and daytime variability only for in situ isoprene. Inset values in (a) and (b) are Pearson’s correlation coefficients (R). Shading shows heatwave periods (orange) in all panels and transition in ozone production regimes (grey) in (c). In situ daytime means are included if all sites have at least 4 hourly measurements that day.")
Tirpitz, J.-L., Frieß, U., Spurr, R., and Platt, U.: Enhancing MAX-DOAS atmospheric state retrievals by multispectral polarimetry – studies using synthetic data, Atmos. Meas. Tech., 15, 2077–2098, https://doi.org/10.5194/amt-15-2077-2022, 2022.
Ground-based multi-axis differential optical absorption spectroscopy (MAX-DOAS) is a widely used measurement technique for the remote detection of atmospheric aerosol and trace gases. The technique relies on the analysis of ultra-violet and visible radiation spectra of scattered sunlight (skylight) to obtain information on different atmospheric parameters. From an appropriate set of spectra recorded under different viewing directions (typically a group of observations at different elevation angles) the retrieval of aerosol and trace gas vertical distributions is achieved through numerical inversion methods.
It is well known that the polarisation state of skylight is particularly sensitive to atmospheric aerosol content as well as aerosol properties and that polarimetric measurements could therefore provide additional information for MAX-DOAS profile retrievals; however, such measurements have not yet been used for this purpose. To address this issue, we have developed the RAPSODI (Retrieval of Atmospheric Parameters from Spectroscopic Observations using DOAS Instruments) algorithm. In contrast to existing MAX-DOAS algorithms, it can process polarimetric information, and it can retrieve simultaneously profiles of aerosols and various trace gases at multiple wavelengths in a single retrieval step; a further advantage is that it contains a Mie scattering model, allowing for the retrieval of aerosol microphysical properties. The forward-model component in RAPSODI is based on a linearised vector radiative transfer model with Jacobian facilities, and we have used this model to create a database of synthetic measurements in order to carry out sensitivity analyses aimed at assessing the potential of polarimetric MAX-DOAS observations. We find that multispectral polarimetry significantly enhances the sensitivity, particularly to aerosol-related quantities. Assuming typical viewing geometries, the degrees of freedom for signal (DOFS) increase by about 50 % and 70 % for aerosol vertical distributions and aerosol properties, respectively, and by approximately 10 % for trace gas vertical profiles. For an idealised scenario with a horizontally homogeneous atmosphere, our findings predict an improvement in the inversion results’ accuracy (root-mean-square deviations to the true values) of about 60 % for aerosol vertical column densities (VCDs) as well as for aerosol surface concentrations and by 40 % for aerosol properties. For trace gas VCDs, very little improvement is apparent, although the accuracy of trace gas surface concentrations improves by about 50 %.

. Each occurrence corresponds to one atmospheric scenario. To reduce overlap between the histograms, HCHO and NO2 profile histogram values have been multiplied by 2. Subplot rows show different measurement modes according to the labels on the left axes. Thick vertical lines indicate median values. The histograms are peak-normalised, so that the vertical axes indicate the number of occurrences in arbitrary units. For extra clarity, histograms for the modal fraction f are shown in separate panels on the far right of the figure. For aerosol properties, the aerosol scenario Aer0 (no aerosol) was excluded here.")
Diese Richtlinie beschreibt das passive DOAS-Messverfahren mit natürlichen Strahlungsquellen, das vor allem für die Absorptionsspektroskopie im ultraviolettem sowie im sichtbaren und nahinfraroten Spektralbereich zum Einsatz kommt. Aufbau, Betrieb, Mindestanforderungen, Kalibrierung und Datenauswertung von Passiv-DOAS-Messsystemen sowie deren Anwendung für Messungen von gasförmigen Komponenten (z.B. SO2, NO2, O3, HCHO, H2O, HONO) sowie von Aerosoleigenschaften in der Atmosphäre werden erläutert. Das Verfahren wird durch eine Vielzahl an Anwendungen illustriert.

Tirpitz, J.-L., Frieß, U., Hendrick, F., Alberti, C., Allaart, M., Apituley, A., Bais, A., Beirle, S., Berkhout, S., Bognar, K., Bösch, T., Bruchkouski, I., Cede, A., Chan, K. L., den Hoed, M., Donner, S., Drosoglou, T., Fayt, C., Friedrich, M. M., Frumau, A., Gast, L., Gielen, C., Gomez-Martín, L., Hao, N., Hensen, A., Henzing, B., Hermans, C., Jin, J., Kreher, K., Kuhn, J., Lampel, J., Li, A., Liu, C., Liu, H., Ma, J., Merlaud, A., Peters, E., Pinardi, G., Piters, A., Platt, U., Puentedura, O., Richter, A., Schmitt, S., Spinei, E., Stein Zweers, D., Strong, K., Swart, D., Tack, F., Tiefengraber, M., van der Hoff, R., van Roozendael, M., Vlemmix, T., Vonk, J., Wagner, T., Wang, Y., Wang, Z., Wenig, M., Wiegner, M., Wittrock, F., Xie, P., Xing, C., Xu, J., Yela, M., Zhang, C., and Zhao, X.: Intercomparison of MAX-DOAS vertical profile retrieval algorithms: studies on field data from the CINDI-2 campaign, Atmos. Meas. Tech., 14, 1–35, https://doi.org/10.5194/amt-14-1-2021, 2021.
The second Cabauw Intercomparison of Nitrogen Dioxide measuring Instruments (CINDI-2) took place in Cabauw (the Netherlands) in September 2016 with the aim of assessing the consistency of multi-axis differential optical absorption spectroscopy (MAX-DOAS) measurements of tropospheric species (NO2, HCHO, O3, HONO, CHOCHO and O4). This was achieved through the coordinated operation of 36 spectrometers operated by 24 groups from all over the world, together with a wide range of supporting reference observations (in situ analysers, balloon sondes, lidars, long-path DOAS, direct-sun DOAS, Sun photometer and meteorological instruments). (…)
.")

Donner, S., Kuhn, J., Van Roozendael, M., Bais, A., Beirle, S., Bösch, T., Bognar, K., Bruchkouski, I., Chan, K. L., Dörner, S., Drosoglou, T., Fayt, C., Frieß, U., Hendrick, F., Hermans, C., Jin, J., Li, A., Ma, J., Peters, E., Pinardi, G., Richter, A., Schreier, S. F., Seyler, A., Strong, K., Tirpitz, J.-L., Wang, Y., Xie, P., Xu, J., Zhao, X., and Wagner, T.: Evaluating different methods for elevation calibration of MAX-DOAS (Multi AXis Differential Optical Absorption Spectroscopy) instruments during the CINDI-2 campaign, Atmos. Meas. Tech., 13, 685–712, https://doi.org/10.5194/amt-13-685-2020, 2020.
We present different methods for in-field elevation calibration of MAX-DOAS (Multi AXis Differential Optical Absorption Spectroscopy) instruments that were applied and inter-compared during the second Cabauw Intercomparison campaign for Nitrogen Dioxide measuring Instruments (CINDI-2). One necessary prerequisite of consistent MAX-DOAS retrievals is a precise and accurate calibration of the elevation angles of the different measuring systems. Therefore, different methods for this calibration were applied to several instruments during the campaign, and the results were inter-compared.
This work first introduces and explains the different methods, namely far- and near-lamp measurements, white-stripe scans, horizon scans and sun scans, using data and results for only one (mainly the Max Planck Institute for Chemistry) instrument. In the second part, the far-lamp measurements and the horizon scans are examined for all participating groups. Here, the results for both methods are first inter-compared for the different instruments; secondly, the two methods are compared amongst each other. (…)

We present the inter-comparison of delta slant column densities (SCDs) and vertical profiles of nitrous acid (HONO) derived from measurements of different multi-axis differential optical absorption spectroscopy (MAX-DOAS) instruments and using different inversion algorithms during the Second Cabauw Inter-comparison campaign for Nitrogen Dioxide measuring Instruments (CINDI-2) in September 2016 at Cabauw, the Netherlands (51.97° N, 4.93° E). The HONO vertical profiles, vertical column densities (VCDs), and near-surface volume mixing ratios are compared between different MAX-DOAS instruments and profile inversion algorithms for the first time. (…)

Tropospheric NO2 and stratospheric NO2 vertical column densities are important TROPOspheric Monitoring Instrument (TROPOMI) data products. In order to validate the TROPOMI NO2 products, KNMI Multi-AXis Differential Optical Absorption Spectroscopy (MAX-DOAS) instruments have measured NO2 on ship cruises over the Atlantic and the Pacific oceans. The MAX-DOAS instruments have participated in five cruises on board RV Sonne (in 2017 and 2019) and RV Maria S. Merian (in 2018). The MAX-DOAS measurements were acquired over 7 months and spanned about 90° in latitude and 300° in longitude. During the cruises aerosol measurements from Microtops sun photometers were also taken. (…)
 along the cruise routes. The two open circles indicate the stationary positions of RV Sonne for the cruise in March 2019 (SO201903) with no Microtops measurements.")
South-eastern Australia has been identified by modelling studies as a hotspot of biogenic volatile organic compound (VOC) emissions; however, long-term observational VOC studies are lacking in this region. Here, 2.5 years of multi-axis differential optical absorption spectroscopy (MAX-DOAS) formaldehyde (HCHO) measurements in Australasia are presented, from Broadmeadows, in northern Melbourne, Australia, and from Lauder, a rural site in the South Island of New Zealand. Across the measurement period from December 2016 to November 2019, the mean formaldehyde columns measured by the MAX-DOAS were 2.50±0.61×10¹⁵ molec. cm−2 at Lauder and 5.40±1.59×10¹⁵ molec. cm−2 at Broadmeadows. In both locations, the seasonal cycle showed a pronounced peak in Austral summer (December–January–February) consistent with temperature-dependent formaldehyde production from biogenic precursor gases. The amplitude of the seasonal cycle was 0.7×10¹⁵ molec. cm−2 at Lauder, and it was 2.0×10¹⁵ molec. cm−2 at Broadmeadows. The Lauder MAX-DOAS HCHO measurements are compared with 27 months of co-located Fourier transform infrared (FTIR) observations. The seasonal variation of Lauder MAX-DOAS HCHO, smoothed by the FTIR averaging kernels, showed good agreement with the FTIR measurements, with a linear regression slope of 1.03 and an R2 of 0.66 for monthly averaged formaldehyde partial columns (0–4 km). In addition to ground-based observations, a clear way to address the VOC measurement gap in areas such as Australasia is with satellite measurements. (…)
 south-eastern Australia showing the location of Melbourne and the Broadmeadows measurement site, and (b) the South Island of New Zealand showing the locations of Lauder and the largest South Island cities, Dunedin and Christchurch. Map generated in Google Earth.")
 Broadmeadows and (b) Lauder. Both the original (orange) and convolved (blue and white, i.e. accounting for different retrieval a priori and sensitivities) MAX-DOAS columns are shown.")
In September 2016, 36 spectrometers from 24 institutes measured a number of key atmospheric pollutants for a period of 17 d during the Second Cabauw Intercomparison campaign for Nitrogen Dioxide measuring Instruments (CINDI-2) that took place at Cabauw, the Netherlands (51.97° N, 4.93° E). We report on the outcome of the formal semi-blind intercomparison exercise, which was held under the umbrella of the Network for the Detection of Atmospheric Composition Change (NDACC) and the European Space Agency (ESA). The three major goals of CINDI-2 were (1) to characterise and better understand the differences between a large number of multi-axis differential optical absorption spectroscopy (MAX-DOAS) and zenith-sky DOAS instruments and analysis methods, (2) to define a robust methodology for performance assessment of all participating instruments, and (3) to contribute to a harmonisation of the measurement settings and retrieval methods. This, in turn, creates the capability to produce consistent high-quality ground-based data sets, which are an essential requirement to generate reliable long-term measurement time series suitable for trend analysis and satellite data validation. (…)
.")
 and the rms calculated as part of the data fitting routine (second value). The instruments with the smallest rms are denoted with the smallest numbers. Note that the instruments are grouped according to their specific design as custom-built, Pandora, EnviMes, Mini-DOAS or SAOZ.")
Retrieving the column of an absorbing trace gas from spectral data requires that all absorbers in the corresponding wavelength range are sufficiently well known. This is especially important for the retrieval of weak absorbers, whose absorptions are often in the 10−4 range.
Previous publications on the absorptions of the oxygen dimer O2–O2 (or short: O4) list absorption peaks at 328 and 419 nm, for which no spectrally resolved literature cross sections are available. As these absorptions potentially influence the spectral retrieval of various trace gases, such as HCHO, BrO, OClO and IO, their shape and magnitude need to be quantified.
We assume that the shape of the absorption peaks at 328 and 419 nm can be approximated by their respective neighbouring absorption peaks. Using this approach we obtain estimates for the wavelength of the absorption and its magnitude. Using long-path differential optical absorption spectroscopy (LP-DOAS) observations and multi-axis DOAS (MAX-DOAS) observations, we estimate the peak absorption cross sections of O4 to be (1.96 ± 0.20) × 10−47 cm5 molec−2 and determine the wavelength of its maximum at 328.59 ± 0.15 nm.
For the absorption at 419.13 ± 0.42 nm a peak O4 cross-section value is determined to be (5.0 ± 3.5) × 10−48 cm5 molec−2.
E43 molec2 cm−5 and O4 328 nm (6.09 ± 0.38)E42 molec2 cm−5 .")
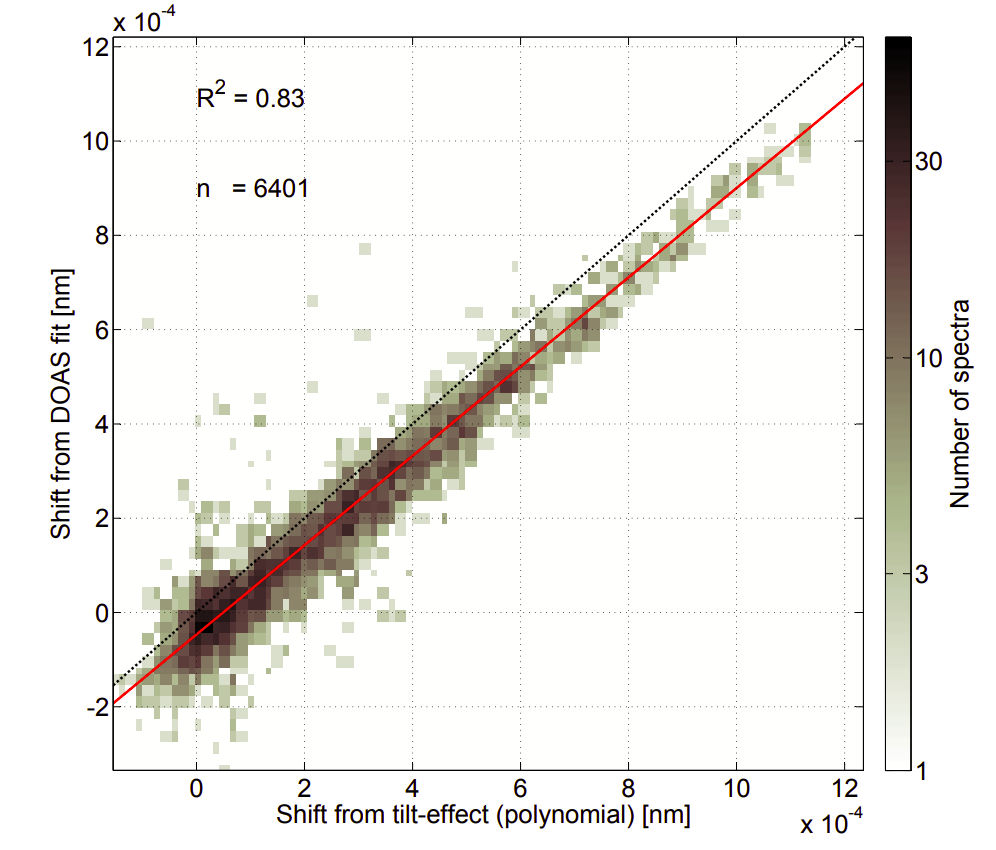
Experience of differential atmospheric absorption spectroscopy (DOAS) shows that a spectral shift between measurement spectra and reference spectra is frequently required in order to achieve optimal fit results, while the straightforward calculation of the optical density proves inferior. The shift is often attributed to temporal instabilities of the instrument but implicitly solved the problem of the tilt effect discussed/explained in this paper.
Spectral positions of Fraunhofer and molecular absorption lines are systematically shifted for different measurement geometries due to an overall slope – or tilt – of the intensity spectrum. The phenomenon has become known as the tilt effect for limb satellite observations, where it is corrected for in a first-order approximation, whereas the remaining community is less aware of its cause and consequences.
It is caused by the measurement process, because atmospheric absorption and convolution in the spectrometer do not commute. Highly resolved spectral structures in the spectrum will first be modified by absorption and scattering processes in the atmosphere before they are recorded with a spectrometer, which convolves them with a specific instrument function. In the DOAS spectral evaluation process, however, the polynomial (or other function used for this purpose) accounting for broadband absorption is applied after the convolution is performed.
In this paper, we derive that changing the order of the two modifications of the spectra leads to different results. Assuming typical geometries for the observations of scattered sunlight and a spectral resolution of 0.6 nm, this effect can be interpreted as a spectral shift of up to 1.5 pm, which is confirmed in the actual analysis of the ground-based measurements of scattered sunlight as well as in numerical radiative transfer simulations. If no spectral shift is allowed by the fitting routine, residual structures of up to 2.5 × 10⁻³ peak-to-peak are observed. Thus, this effect needs to be considered for DOAS applications aiming at an rms of the residual of 10−3 and below.

In order to promote the development of the passive DOAS technique the Multi Axis DOAS – Comparison campaign for Aerosols and Trace gases (MAD-CAT) was held at the Max Planck Institute for Chemistry in Mainz, Germany, from June to October 2013. Here, we systematically compare the differential slant column densities (dSCDs) of nitrous acid (HONO) derived from measurements of seven different instruments. We also compare the tropospheric difference of SCDs (delta SCD) of HONO, namely the difference of the SCDs for the non-zenith observations and the zenith observation of the same elevation sequence. Different research groups analysed the spectra from their own instruments using their individual fit software. All the fit errors of HONO dSCDs from the instruments with cooled large-size detectors are mostly in the range of 0.1 to 0.3 × 10¹⁵ molecules cm−2 for an integration time of 1 min. The fit error for the mini MAX-DOAS is around 0.7 × 10¹⁵ molecules cm−2. Although the HONO delta SCDs are normally smaller than 6 × 10¹⁵ molecules cm−2, consistent time series of HONO delta SCDs are retrieved from the measurements of different instruments. Both fits with a sequential Fraunhofer reference spectrum (FRS) and a daily noon FRS lead to similar consistency. Apart from the mini-MAX-DOAS, the systematic absolute differences of HONO delta SCDs between the instruments are smaller than 0.63 × 10¹⁵ molecules cm−2. The correlation coefficients are higher than 0.7 and the slopes of linear regressions deviate from unity by less than 16 % for the elevation angle of 1°. The correlations decrease with an increase in elevation angle. All the participants also analysed synthetic spectra using the same baseline DOAS settings to evaluate the systematic errors of HONO results from their respective fit programs. In general the errors are smaller than 0.3 × 10¹⁵ molecules cm−2, which is about half of the systematic difference between the real measurements. (…)
.")
In remote sensing applications, such as differential optical absorption spectroscopy (DOAS), atmospheric scattering processes need to be considered. After inelastic scattering on N2 and O2 molecules, the scattered photons occur as additional intensity at a different wavelength, effectively leading to “filling-in” of both solar Fraunhofer lines and absorptions of atmospheric constituents, if the inelastic scattering happens after the absorption.
Measured spectra in passive DOAS applications are typically corrected for rotational Raman scattering (RRS), also called Ring effect, which represents the main contribution to inelastic scattering. Inelastic scattering can also occur in liquid water, and its influence on DOAS measurements has been observed over clear ocean water. In contrast to that, vibrational Raman scattering (VRS) of N2 and O2 has often been thought to be negligible, but it also contributes.
Consequences of VRS are red-shifted Fraunhofer structures in scattered light spectra and filling-in of Fraunhofer lines, additional to RRS. At 393 nm, the spectral shift is 25 and 40 nm for VRS of O2 and N2, respectively. We describe how to calculate VRS correction spectra according to the Ring spectrum. (…)
 related to the additional intensities in Fig. 2.")
Active remote sensing measurement studies involving OPEN PATH instruments
Schmitt, T. D., Kuhn, J., Kleinschek, R., Löw, B. A., Schmitt, S., Cranton, W., Schmidt, M., Vardag, S. N., Hase, F., Griffith, D. W. T., and Butz, A.: An open-path observatory for greenhouse gases based on near-infrared Fourier transform spectroscopy, Atmos. Meas. Tech., 16, 6097–6110, https://doi.org/10.5194/amt-16-6097-2023, 2023.
Monitoring the atmospheric concentrations of the greenhouse gases (GHG) carbon dioxide (CO2) and methane (CH4) is a key ingredient for fostering our understanding of the mechanisms behind the sources and sinks of these gases and for verifying and quantitatively attributing their anthropogenic emissions. Here, we present the instrumental setup and performance evaluation of an open-path GHG observatory in the city of Heidelberg, Germany. The observatory measures path-averaged concentrations of CO2 and CH4 along a 1.55 km path in the urban boundary layer above the city. We combine these open-path data with local in situ measurements to evaluate the representativeness of these observation types on the kilometer scale. This representativeness is necessary to accurately quantify emissions, since atmospheric models tasked with this job typically operate on kilometer-scale horizontal grids.
For the operational period between 8 February and 11 July 2023, we find a precision of 2.7 ppm (0.58 %) and 18 ppb (0.89 %) for the dry-air mole fractions of CO2 (xCO2) and CH4 (xCH4) in 5 min measurements, respectively. After bias correction, the open-path measurements show excellent agreement with the local in situ data under atmospheric background conditions. Both datasets show clear signals of traffic CO2 emissions in the diurnal xCO2 cycle. However, there are particular situations, such as under southeasterly wind conditions, in which the in situ and open-path data reveal distinct differences up to 20 ppm in xCO2, most likely related to their different sensitivity to local emission and transport patterns.
Our setup is based on a Bruker IFS 125HR Fourier transform spectrometer, which offers a spacious and modular design providing ample opportunities for future refinements of the technique with respect to finer spectral resolution and wider spectral coverage to provide information on gases such as carbon monoxide and nitrogen dioxide.
. The reflector array is located on the roof of the old physics institute (OPI). The light path passes predominantly over a residential area. At the western end (just 120 m east of the IUP) the path crosses a major road with heavy commuter traffic. Base map: © Google Earth.")
 and weekends (dashed lines). Open-path (blue) and in situ (orange) cycles are in good accordance on weekends. Shaded areas give a statistical 1-sigma confidence level of the mean. On weekdays, the in situ instrument systematically measures 1 to 2 ppm greater values than the open-path instrument.")
Krause, K., Wittrock, F., Richter, A., Schmitt, S., Pöhler, D., Weigelt, A., and Burrows, J. P.: Estimation of ship emission rates at a major shipping lane by long-path DOAS measurements, Atmos. Meas. Tech., 14, 5791–5807, https://doi.org/10.5194/amt-14-5791-2021, 2021.
Ships are an important source of SO2 and NOx, which are key parameters of air quality. Monitoring of ship emissions is usually carried out using in situ instruments on land, which depend on favourable wind conditions to transport the emitted substances to the measurement site. Remote sensing techniques such as long-path differential optical absorption spectroscopy (LP-DOAS) measurements can supplement those measurements, especially in unfavourable meteorological conditions. In this study 1 year of LP-DOAS measurements made across the river Elbe close to Hamburg (Germany) have been evaluated.
Peaks (i.e. elevated concentrations) in the NO2 and SO2 time series were assigned to passing ships, and a method to derive emission rates of SO2, NO2 and NOx from those measurements using a Gaussian plume model is presented. A total of 7402 individual ship passages have been monitored, and their respective NOx, SO2 and NO2 emission rates have been derived. The emission rates, coupled with the knowledge of the ship type, ship size and ship speed, have been analysed. Emission rates are compared to emission factors from previous studies and show good agreement. In contrast to emission factors (in grams per kilogram fuel), the derived emission rates (in grams per second) do not need further knowledge about the fuel consumption of the ship. To our knowledge this is the first time emission rates of air pollutants from individual ships have been derived from LP-DOAS measurements. (…)
 Satellite image of instrument location, with the LP-DOAS marked as a red dot on the northern river bank and the retroreflector position marked as a yellow dot on the southern river bank. (b) Image of a passing container ship next to the measurement site. (c) Schematic overview of the measurement geometry of the LP-DOAS for a passing ship leaving Hamburg towards the North Sea, seen from above. (d) Same as panel (c) but seen from the port of Hamburg. Note that panels (c) and (d) are not to scale.")

More press releases and studies on demand.
